
How much money do small businesses really make? What about solopreneurs and gig workers? Do many small businesses bring in revenues that exceed a million dollars a year? Do small business owners live the American Dream? Vacation at luxury resorts? Fly off to exotic locations in their private jet while their legions of employees keep everything running smoothly back home? Or do they struggle to make ends meet? Where does the myth end and reality begin?
The answer depends on many variables, but for the most part, businesses can be divided into two broad categories:
On one hand, there is the relatively small number of businesses that have 10 or 20 or more employees. Some of these - a very, very few - have concepts, business models, and leadership that venture capitalists and private equity firms believe could evolve into high-growth, high-profit companies. Although they are a tiny minority of small businesses, they are the ones that make the news when they grow from scrappy startups into the Googles and Apple Computer companies of the world.
On the other hand, there are the rest of the small businesses in the country. These are the everyday businesses that don't interest VCs and other investors who look for big paydays.
Every day small businesses are the kinds of businesses that aren't likely to revolutionize their industries. They are the gig workers, solo businesses, and business owners with just a handful of employees. They are the software developers, electrical contractors, freelance writers, salvage companies, bagel store owners, consultants, automotive parts dealers, pet store owners, Internet publishers, accountants, small manufacturers, and other companies that provide needed products and services that aren't revolutionary in concept. They are the small businesses in your town or at the local strip mall. They are the businesses in the local industrial park or office building downtown. And they are the home-based businesses in your neighborhood or maybe your own basement. They generate income, but not big bucks. Some are side gigs or part-time operations. Most are full-time businesses.
For the most part, these small businesses have few employees. According to the latest US Census Bureau statistics, there were about 7.6 million employer firms (ie, businesses with employees) operating in the United States in 2017. Of those businesses, 89% have less than 20 employees.
Related: Small Business Definition
In fact, the majority of US small businesses are very small. Approximately 80% of small businesses are non-employer businesses. A December 2020 report from the Census Bureau shows approximately 25.3 million nonemployer businesses in 2017. These nonemployers are self-employed individuals who pay taxes but are not counted in the monthly jobs reports that are based on payroll data because they do not have a payroll.
These very small businesses are businesses we know well at BusinessKnowHow.com. They are our audience.*
Periodically we run surveys to determine the characteristics and the interests of the business people who visit our site so we can continue to provide the type of small business information they will find useful in their business. In almost all the surveys we conduct, we include questions asking survey-takers about business ownership and gross annual sales.
So, how much money do these small businesses really make?
In 2020, the sales figures were particularly dire for many small businesses. When we looked at the US results of our 2020 COVID small business economic impact survey, we found that 43% of businesses that said they were operating full time were estimating annual sales of under $50,000 for the year. In 2018, only 37% of full-time US-based businesses reported sales under $50,000.
Earnings problems due to the pandemic are continuing for many small businesses in the first quarter of 2021. The US Census Bureau Small Business Pulse survey reports, for example, that the first week in March, 71.8 percent of small businesses were still seeing a moderate to large negative impact on business from the pandemic.
Annual sales of bigger small businesses who responded to our survey ranged lower in 2020 than they did in 2018. In 2020, only 27% estimated their sales for the year would be over $200,000, whereas 32% reported sales over $200,000 in 2018.

Over the years, our surveys have shown that companies with business revenue of $100,000 and over tend to correlate with the age of the business and whether the business has employees. Generally speaking, full-time business owners with employees are at the helm of businesses bringing in significant sales.
RELATED: Review and Plan to Increase Your Sales
The graphs below are from the results of our 2018 survey. They represent all small business owners who responded to the survey, not just the solo entrepreneurs. They show two views of annual sales. The first includes both part-time and full-time businesses. The second graph omits the annual sales of those who responded that they worked part-time in their business (ie, its full-time business owners). Not surprisingly the percentage of businesses earning less than $25,000 is higher when part-time businesses are included, and the percent of businesses making more than $200,000 is higher in the graph that excludes part-time businesses.
As you look at the figures below, remember that annual sales do not equal profit. It does not take into account any of the businesses' expenses.

How do this year's sales compare to sales reported by our survey takers in previous years? Well, there are some variations, as this multi-year comparison shows. But overall, a little less than half of the small businesses who visit our site report earnings of under $50,000.
While this graph isn't broken down by length of time in business or whether the businesses are part-time or full-time, in general, the lowest earners tend to be startups and part-time businesses.
How does the information we gathered stack up against data from other sources? Because we used different income ranges than other sources and didn't sort our data by nonemployers vs employers as government agencies do, there's no way to draw direct comparisons. But a December 2020 report from the Office of Advocacy shows that as of 2017, the average nonemployer (excluding C-corporations) had receipts of $47,000. in 2017. However, there were some significant differences by demographic group. The report found that the average of receipts for women ($27,000), veteran ($42,000), African American ($22,000), and Hispanic ($36,000) nonemployers were well below the national average. Both Asian and White nonemployers individually averaged $48,000 in receipts.
Census data also shows that few small businesses have high sales. According to the 2016 US Census statistics, the average annual sales for the nation's million nonemployers was only $46,978. In fact, a 2016 Federal Reserve Banks report found that 45% of the nonemployers had revenues of less than $25,000 a year.
As noted, these government annual revenue figures - the latest available as we updated this article - were from 2017 and do not include drops in revenue due to the pandemic.
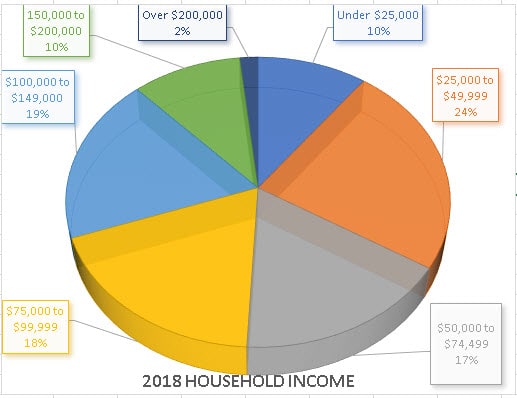
What about profit on those sales? We've never asked survey-takers to indicate their profits, but we did ask survey-takers to indicate what their household income is. The household income would include the owner's salary, profits from the business (in most small businesses, the profits pass through to the owners), as well as any non-business income the business owner or their spouse brings in.
Of the business owners in the US who responded to that question, 31% had household incomes of $100,000 or more., and 35% had household incomes between $50,000 and $99,999.
By way of comparison, Payscale reports that the average salary of small business owner/operators is $65,486.
Notes:
*BusinessKnowHow.com reaches millions of individual small business owners and professionals worldwide. Homebased businesses accounted for 66% of the businesses who responded to our 2018 survey. A little over 48% percent indicated they are one-person businesses.
**Our survey data was filtered to display only the responses from US business owners.
RELATED: How to Get Paid What You're Worth
© 2020 Attard Communications, Inc. All Rights Reserved. May not be reproduced, reprinted or redistributed without written permission from Attard Communications, Inc.
About the author:
Janet Attard is the founder of the award-winning Business Know-How small business web site and information resource. A small business and home business expert, Janet is the author of several books including The Home Office And Small Business Answer Book and of Business Know-How: An Operational Guide For Home-Based and Micro-Sized Businesses with Limited Budgets. Her company, Attard Communications, Inc., has been creating online content sites for 30 years. Follow Janet on Twitter and on LinkedIn. Read more about Janet on JanetAttard.com.


